Tools
7 Free Windows Diagnostic Tools for Slowdowns, Freezes, and Crashes
A comprehensive, step-by-step guide to the 7 Free Windows Tools I Use to Diagnose a Slow or Unstable PC — including PerfMon, Process Explorer, Autoruns, Resource Monitor, BlueScreenView, CrystalDiskInfo, and Windows Memory Diagnostic. Fully tested on Windows 10 and 11.

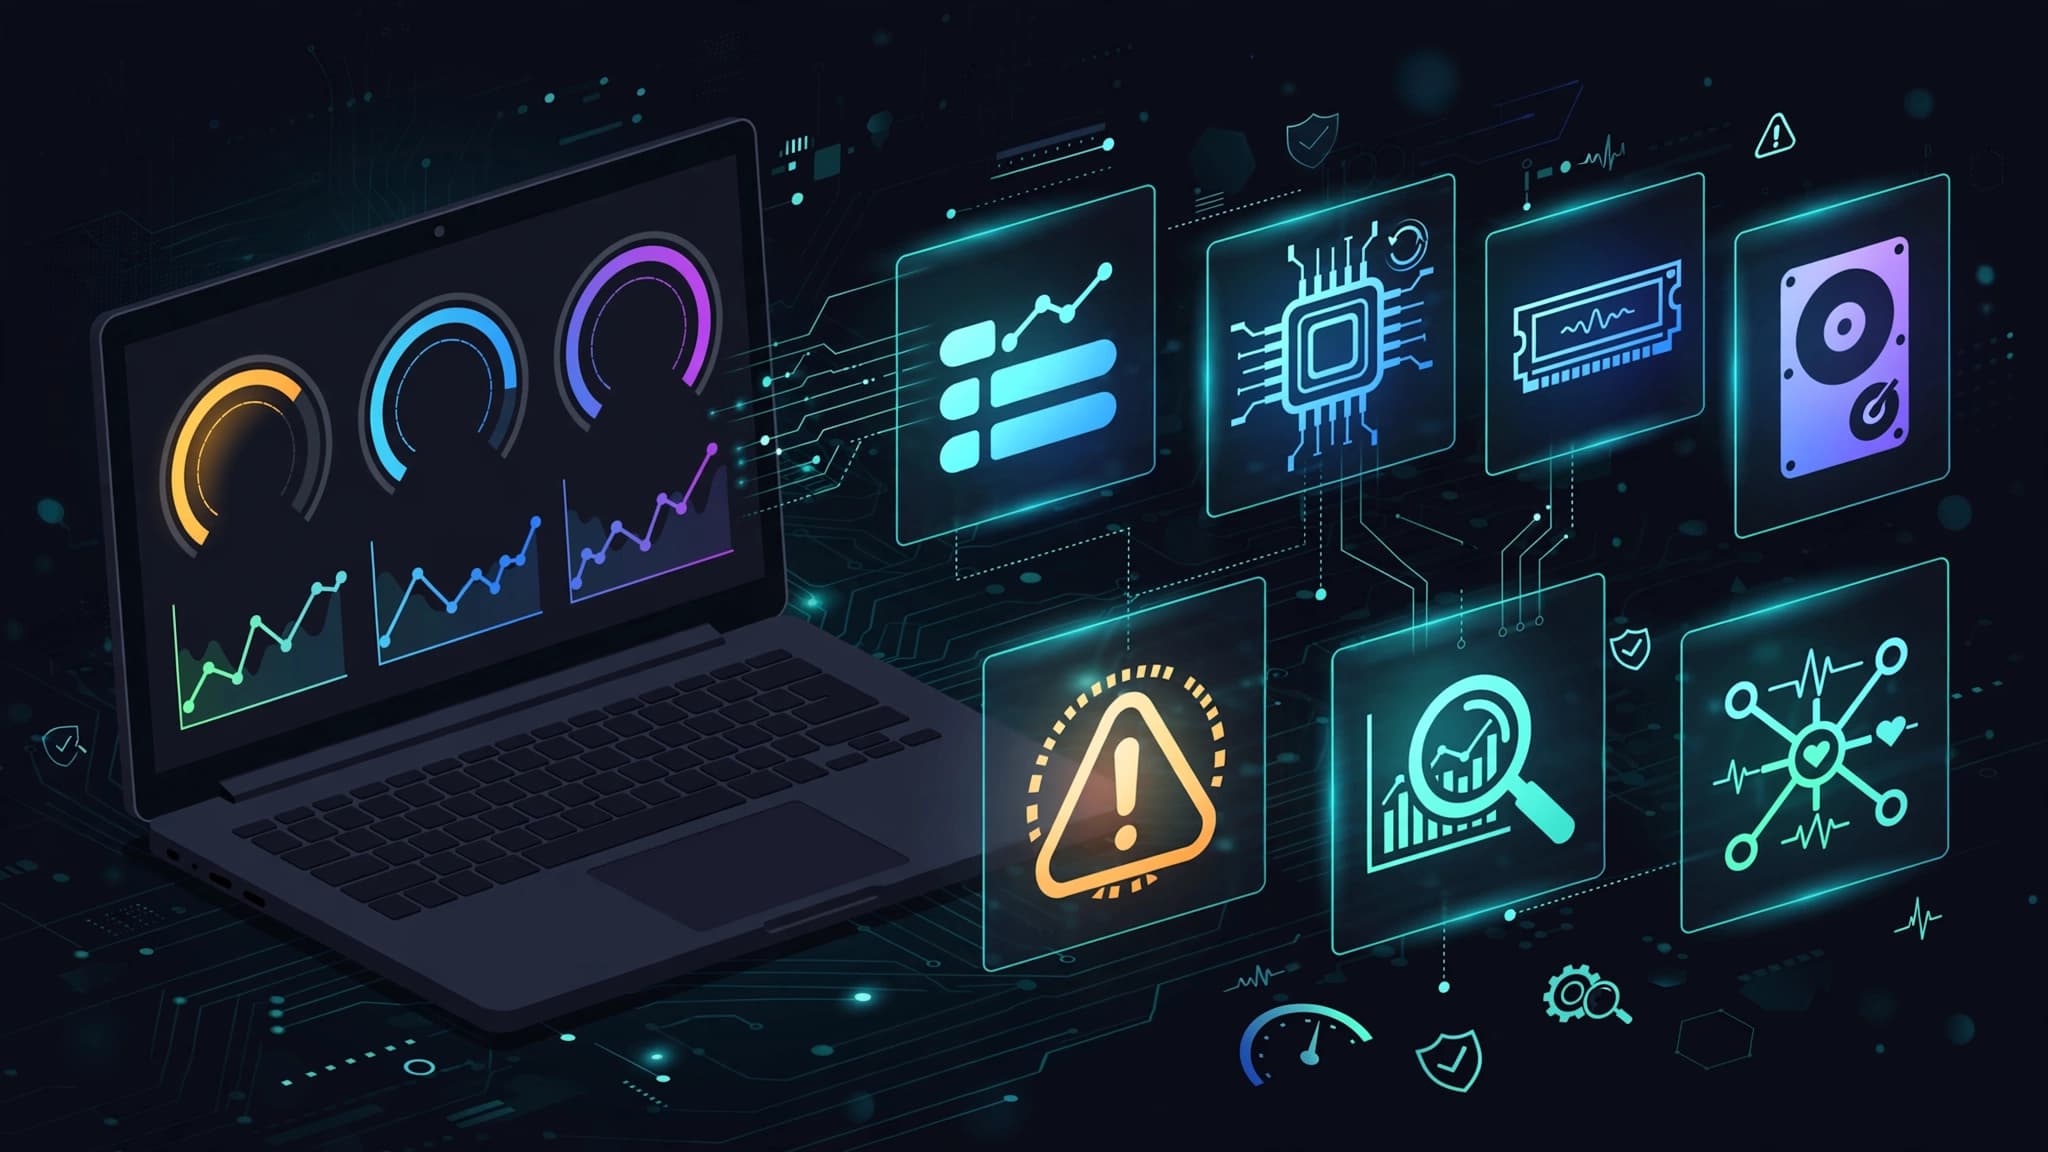
If your Windows PC feels unusually slow, freezes at random, or crashes without a clear reason, the first step should be diagnosis—not guessing.
Windows already includes several useful diagnostic tools, and Microsoft also provides free utilities through Sysinternals. Combined with a few reputable third-party tools, you can investigate CPU usage, memory pressure, disk activity, startup programs, drivers, storage health, and crash information without paying for diagnostic software.
This guide covers 7 free Windows tools you can use to diagnose a slow or unstable PC, what each one is good at, and how to use them as part of a practical troubleshooting workflow.
1. Windows Performance Monitor (PerfMon)
Performance Monitor, commonly opened with perfmon.msc, is a built-in Windows tool for collecting and reviewing system performance data over time.
Unlike Task Manager, which is mainly useful for a quick snapshot, Performance Monitor can log counters for longer periods. That makes it useful when a slowdown or freeze happens intermittently and disappears before you can inspect it.
What PerfMon Can Help You Investigate
You can monitor areas such as:
- CPU utilization;
- available memory;
- disk activity;
- system uptime;
- process-level performance;
- network counters.
Create a Custom Data Collector Set
To create a basic logging session:
- Press
Win + R. - Type
perfmon.mscand press Enter. - Open Data Collector Sets → User Defined.
- Right-click and choose New → Data Collector Set.
- Select Create manually.
- Add the performance counters you want to monitor.
Useful starting counters may include:
Processor(_Total)\% Processor TimeMemory\Available MBytesPhysicalDisk(_Total)\Avg. Disk Queue LengthSystem\System Up Time
Run the collector while reproducing the problem, then review the resulting log afterward.
How to Interpret the Results
A single spike is not always meaningful. Look for sustained patterns that correlate with the slowdown.
For example:
- CPU usage that remains unusually high;
- available memory becoming very low during the issue;
- disk activity rising sharply while applications stop responding;
- a specific process gradually consuming more resources over time.
Microsoft provides more information about Performance Monitor and Windows performance tools in its official documentation.
2. Process Explorer
Process Explorer is part of Microsoft’s Sysinternals utilities.
It provides a more detailed process view than the standard Task Manager and can help you understand which processes are consuming resources or loading particular files and modules.
Useful Information Available in Process Explorer
Depending on the process and your permissions, you can inspect:
- CPU and memory usage;
- parent and child processes;
- command-line arguments;
- open handles;
- loaded DLLs;
- threads;
- digital signatures.
Use the Process Tree
The process tree is particularly useful when an application launches multiple child processes.
Instead of seeing several unrelated process names, you can understand which application started them.
This can help when investigating:
- browser processes;
- background updaters;
- development tools;
- services;
- unexpected processes.
Check Suspicious Processes Carefully
Process Explorer can integrate with VirusTotal for additional reputation information.
To learn more, use Microsoft’s official Process Explorer documentation.
A VirusTotal result is useful context, but it should not be treated as absolute proof that a file is safe or malicious.
3. Autoruns
Autoruns is another Microsoft Sysinternals tool that shows many locations Windows uses to automatically start programs, services, drivers, scheduled tasks, and other components.
This makes it useful when a PC has:
- slow startup;
- too many background utilities;
- unexpected processes after login;
- software conflicts;
- suspected persistence from unwanted software.
Start With Non-Microsoft Entries
Autoruns contains a large amount of information, so do not disable items randomly.
A safer starting approach is to enable the option that hides Microsoft entries and then review third-party items.
Look at:
- publisher;
- file path;
- digital signature;
- whether you recognize the software;
- whether the application is still installed and needed.
Disable Before Deleting
If you want to test whether an entry causes a problem, disable it first instead of deleting it.
This makes it easier to reverse the change if the issue remains or another application stops working.
Microsoft’s Autoruns documentation explains the categories and available features.
4. Windows Resource Monitor
Resource Monitor, opened with resmon.exe, provides a real-time view of CPU, memory, disk, and network activity.
I find it most useful when the problem is happening right now and you want to see which process is actively using a resource.
Use the Disk Tab for Slow Storage Activity
The Disk tab shows which processes are reading and writing data and which files they are accessing.
This can help you identify whether a slowdown is associated with:
- Windows Update;
- search indexing;
- cloud synchronization;
- antivirus scanning;
- a large application database;
- another process performing heavy disk activity.
Use the Network Tab for Background Traffic
The Network tab shows network activity by process.
If the internet connection feels slow or a background application is uploading or downloading unexpectedly, this view can help identify the process involved.
Understand Hard Faults Carefully
The Memory tab includes a Hard Faults/sec metric.
A hard fault does not automatically mean hardware failure. It means Windows had to retrieve memory data from disk because that data was not currently available in physical RAM.
A high rate can indicate memory pressure, but the value should be interpreted together with available memory, committed memory, application behavior, and overall system responsiveness.
5. BlueScreenView
If Windows crashes with a Blue Screen of Death, the system may create a memory dump containing information about the crash.
BlueScreenView from NirSoft provides a relatively simple way to inspect Windows minidump files.
You can download it from the official NirSoft website.
What BlueScreenView Shows
Depending on the available dump data, it can show:
- bug check or stop code;
- crash time;
- drivers and modules present in the stack;
- addresses associated with the crash.
Do Not Assume the Highlighted Driver Is Always the Cause
This is important.
A driver appearing near the crash does not automatically mean that driver caused the problem.
Windows crash analysis can be complex. A driver may appear in the stack because it was active when another component corrupted memory earlier.
Use BlueScreenView as a starting point for investigation rather than definitive proof.
For deeper analysis, Microsoft’s WinDbg documentation provides more advanced debugging options.
Look for Patterns Across Multiple Crashes
One crash may not tell you much.
If several recent crashes repeatedly involve the same driver, device, or stop code, that pattern becomes more useful.
You can then check:
- recent driver updates;
- Windows Update history;
- manufacturer support pages;
- related hardware diagnostics.
6. CrystalDiskInfo
A storage problem can make Windows feel slow, cause applications to hang, and sometimes contribute to data corruption or boot problems.
CrystalDiskInfo displays S.M.A.R.T. information reported by supported HDDs and SSDs.
Download it from the official Crystal Dew World website.
What S.M.A.R.T. Data Can Tell You
Depending on the drive, you may see information such as:
- drive temperature;
- power-on hours;
- reallocated sectors;
- interface errors;
- vendor-specific wear indicators;
- overall health status.
Do Not Use One Universal Threshold for Every Drive
S.M.A.R.T. attributes differ between manufacturers and between HDDs and SSDs.
A raw value that looks concerning on one model may be interpreted differently on another.
If CrystalDiskInfo reports Caution or Bad, treat that as a reason to investigate and back up important data immediately.
For exact interpretation, check documentation from the drive manufacturer when available.
Interface Errors Can Also Matter
Some S.M.A.R.T. data may indicate communication problems rather than internal drive failure.
For example, on a SATA system, repeated interface errors can sometimes be associated with:
- a damaged cable;
- a loose connection;
- a controller issue.
This is why storage diagnostics should consider the entire storage path, not only the drive itself.
7. Windows Memory Diagnostic
Unstable memory can cause difficult-to-reproduce problems such as application crashes, installation failures, freezes, or blue screens.
Windows includes a basic memory test called Windows Memory Diagnostic.
How to Run It
- Press
Win + R. - Type
mdsched.exe. - Select the option to restart and check for problems.
- Save your work before restarting.
The test runs outside the normal Windows desktop environment and checks system memory for errors.
A Passing Test Does Not Guarantee Perfect RAM
Windows Memory Diagnostic is useful as an initial check, but intermittent memory problems can be difficult to reproduce.
If you continue seeing symptoms strongly associated with RAM even after the built-in test passes, you may need a more extensive memory-testing process or hardware troubleshooting.
If the Test Finds Errors
Possible causes can include:
- a faulty memory module;
- poor seating in the memory slot;
- incompatible memory settings;
- overclocking or unstable memory profiles;
- a motherboard or memory-controller problem.
Do not immediately assume the RAM module itself is the only possible cause.
A Practical Diagnostic Workflow
You do not need to launch all seven tools every time.
Start with the symptom and work from the simplest observation toward deeper analysis.
Phase 1: Quick Triage
- Open Resource Monitor while the slowdown is happening.
- Check CPU, memory, disk, and network activity.
- Open Process Explorer if a specific process needs deeper inspection.
- Check CrystalDiskInfo if storage behavior looks suspicious.
Phase 2: Investigate Recurring Problems
- Use Performance Monitor to collect data over time.
- Review Autoruns for unnecessary or suspicious startup components.
- Check recent software and driver changes.
Phase 3: Investigate Crashes
- Check whether Windows created minidump files.
- Review them with BlueScreenView for initial clues.
- Look for repeated patterns across multiple crashes.
- Use deeper debugging tools when necessary.
Phase 4: Check Memory
If symptoms include random crashes, corrupted data, or unexplained instability, run Windows Memory Diagnostic.
Important Safety Notes
Most tools in this guide are primarily diagnostic, but some allow you to terminate processes or disable startup components.
Before changing anything:
- save important work;
- create backups when appropriate;
- document what you disable;
- avoid disabling Windows components you do not understand;
- download third-party utilities only from their official websites.
Frequently Asked Questions
Can I use these tools on Windows 11?
The built-in Windows tools covered here are available on current Windows systems, while Process Explorer and Autoruns are maintained through Microsoft Sysinternals.
For BlueScreenView and CrystalDiskInfo, check the current compatibility information on their official websites before downloading.
Are these tools safe?
The diagnostic functions themselves are generally safe when the tools are downloaded from official sources and used correctly.
However, some tools allow actions that can affect the running system.
For example:
- Process Explorer can terminate processes;
- Autoruns can disable startup entries;
- administrative access exposes more sensitive system information.
Use those features carefully.
Do I need technical expertise?
You can use Resource Monitor, CrystalDiskInfo, and basic Process Explorer features without advanced Windows knowledge.
Performance counters, crash dump analysis, drivers, and kernel-level troubleshooting require more interpretation.
If you are unsure about an entry or driver, research it before disabling or removing anything.
What if none of these tools identify the problem?
Additional troubleshooting may include:
- checking Event Viewer;
- installing Windows and driver updates;
- using a clean boot to isolate software conflicts;
- checking system files with Microsoft’s supported repair tools;
- running manufacturer hardware diagnostics;
- testing components individually when hardware failure is suspected.
If the system contains important data and appears to have a failing drive, prioritize backups before continuing extensive testing.
How This Guide Was Prepared
This guide focuses on free diagnostic tools that provide direct visibility into common Windows performance and stability problems.
Because Windows, device drivers, storage firmware, and third-party utilities change over time, exact menus and available features may differ between versions.
Where possible, use current Microsoft documentation and official vendor download pages when installing or configuring diagnostic tools.
Final Takeaway
A slow or unstable Windows PC is easier to troubleshoot when you stop treating every symptom as the same problem.
Each tool in this guide answers a different question:
- Performance Monitor: What is happening over time?
- Process Explorer: What is this process actually doing?
- Autoruns: What starts automatically with Windows?
- Resource Monitor: Which resource is busy right now?
- BlueScreenView: What information is present in recent crash dumps?
- CrystalDiskInfo: What health information is the drive reporting?
- Windows Memory Diagnostic: Can the built-in memory test detect an error?
Start with the symptom, collect evidence, change one thing at a time, and verify whether the change actually affects the problem.
That approach is usually more reliable than installing cleanup utilities, changing random settings, or replacing hardware before you know what is wrong.
Recommended for you 👇